Buildings are very interesting spaces that are currently being explored in the digital space. One of the reasons is the difficulty in expressing spaces in a way that is intuitive that assists in traversing the locations as easy as we do physically. Our physical representation of buildings is quite intuitive for example, maps or floorplans. They aid in effectively representing the different rooms in a building [1]. Representations could handling plumbing, fixtures, and additional structural information for construction. These representations without the engineering frame of reference becomes a map for finding one’s way around the building. It works and it is easy.
One of the ideas I have been toying with is to represent the building in a way that is sparse and still contains enough information for services to build on top of it. The hierarchical decomposition of a building can be divided into a habitation unit and rooms inside the habitation unit. This breakdown of components in a building or occupied environment allows to build upon three layers of how buildings can be seen:
- The human layer at which people interact and move about. This is the 3-dimensional space in which we live and interact inside the building.
- The thermal layer representing the energy use and interactions in the environment leading to consumption of energy.
- A device layer for establishing devices, sensors, and control apparatus within a building / habitation unit that enables to construct contextual services better.
The Layers
The human activity layer is quite interesting. Let me draw up a potential set of actions that could occur in the morning. This is from my viewpoint and is actually my set of possible actions for myself in the morning. Any resemblance to yours is purely coincidental.

If there are transition probabilities in the above chart, a markov chain is formed on how I spend my mornings. But the network above does not only give a perspective on my actions but it also shows my interactions with my home. It provides information on how I interact, navigate my building. By decomposing my activity in to zones at which it is performed, a simple map of my home is formed. Even if I, as an identified individual is removed, the map can be functional for any other range of activities.
From an energy use perspective, how does this map help us? It still maps to human activity. Human interactions at different rooms / zones lead to consumption of energy. In winter, heating, if available, is across the whole building and consumes energy. Appliances that are constantly consuming are installed in specific rooms and interactions with other appliances indicate an increased consumption. These patterns are available from energy use information, indoor temperature information, and heating information.
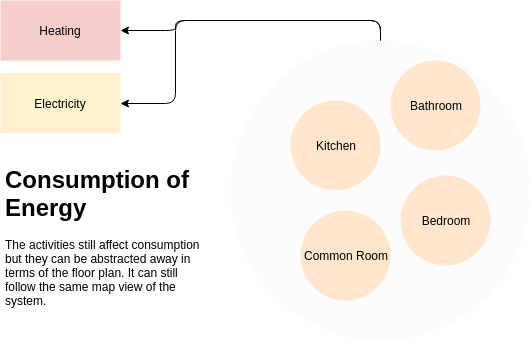
This interpretation is one a superficial level. This can also be abstracted as a thermal resistance circuit. However, such representations are even highly specific [2]. Thinking in energy layers, also allows us to create generalised viewpoints into buildings. An easy to use abstraction is to create relevance for optimisation. How will a simple abstracted floor plan tie in with energy utilisation and human activity?
The electronic layer is a third layer of buildings. The equipment and appliances that are inside the building for different utilisations. For example, the positioning of devices that sense the environment or the utilisation can also take on a floor plan approach.

It provides a basis for relating the physical space with two different layers. The interaction layer and the electronic sensing layer. Composing the three layers, you get an interesting view of how a habitation unit is put together. Ideally, the combination of three layers gives enough information to build a view that encourages privacy as all consumers in a 3-bedroom apartment will be an interesting search syntax for an utility or energy provider to analyse and establish insights from. So, how does a synctactical representation of such a system look like?
apartment:<id> OF size:<sq. meters>, orientation:<direction>
LOCATED IN building:<id>
HAVING
    1 ROOM AS zone:kitchen WITH 1 SENSOR MEASURING var:[<heat>]
    2 ROOM AS zone:bedroom WITH 2 SENSOR MEASURING var:[<heat>, <co2>]
    1 ROOM AS zone:bathroom WITH 1 SENSOR MEASURING var:[<heat>]
    1 ROOM AS zone:common WITH 1 SENSOR MEASURING var:[<heat>]
WITH
    1 SENSOR MEASURING var:<energy>
Additional metadata for each zone can be added and will in fact provide richer ways to look at the data. The above statement is a simplified example of how a building or a house can be described. It above helps us understand that buildings and houses can be described as graphs.
Graph Representation of a Building
The diagram below is a graph-representation of a building along with apartments in that building and what are zones inside the apartment.
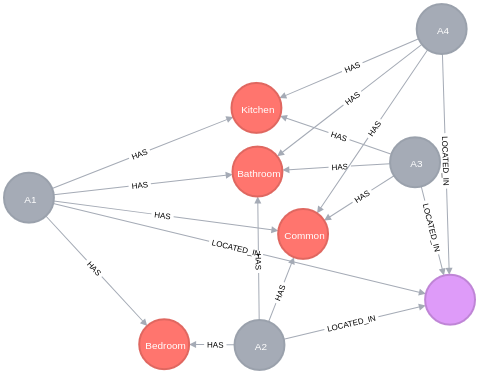
A hierarchical structure of a building is usually how we interact with it. We have a building with multiple floors and habitation units. Each habitation unit has different rooms. This structure is maintained. Each room could have its own sensors, control methodology. As ventilation equipment could interact with each individual room or collectively if there are centralised providers of air and heat.
This representation allows us to interact with a building in any of the three layers if required. At the sensor level, understanding sensors and control devices at any of the positions in the building allows for creating a better control algorithm if personalisation is key. It gives interesting ways to look at the control architecture and find paths that need optimisation. Hotels and complex residential buildings are good examples where this would be useful.
At an energy usage level, the costs involved to the building and the proportional impact of homes / apartments in the buildings can be factored in as costs. Enabling methods to identify whether relationships are deteriorating over time. The relationship analogy can change over time indicating worse or better usages giving power to not only improve building level efficiencies but also help in conveying clearer messages to consumers in the particular building.
A standardised and uniform representation of buildings across literature allows key simulations be carried out with the same frame of reference. Same networks can be quickly shared and different parameters can be added or removed. Relationships with a building follow a network and this helps in isolating networks which are similar in structure. For example: all 3-bedroom 2-bathroom residential units is a way to identify a structure within the network.
Similar Representation: Brick Schema
One similar representation of the schema discussed is the Brick schema. It uses a triple graph store. While the underlying system, sketched out in this blog post, uses the labeled property graph. The major differentiations in the architecture can be read here. One of the reasons I chose the labeled property graph from neo4j is the tooling. It provides quick access to prototyping a graph table and experimenting with creating graph tables.
Aside from the technical differences of the underlying graph database architecture. The Brick schema looks at the primary use case of handling HVAC behavior within a building and control mechanisms for the inhabitants of the building. The idea here is to employ the same graph representation structure for additional layers for services based on buildings.
For example, a relevant usecase would be to structure the responses from the Residential Energy Consumption Survey [3]. It gives a quick way to understand the underlying networks and answer questions which are useful in understanding consumption patterns in the network of answers. In the parallel layer, the sensor architecture can be used to define the consumption results in the system. And in another layer store historical performance characteristics of the building and the units.
From here …
An unified method of handling buildings will accelerate certain aspects of how we integrate technology in everyday life. It not only becomes easier for implementing digital tools but also revisit older buildings with accelerated decision making to make them efficient and more usable. However, the ideas here are incomplete, and will benefit from a critical eye and a more robust discussion on not only implementation but also the concepts therein.